What Are SVGs?
Scalable Vector Graphics are precisely what they say they are, they're graphics that can be scaled down, or up, as much as you want without compromising quality. Vectors have always been a firm favourite for illustrative pieces and concepts, but it's great to see the transition over to the world of website design and we're really excited to see how we can make best use of them.Our design team initially started implementing SVGs as site logos. This meant that the most important thing on the website ( the branding, ) would always look super sharp and high quality regardless of whether you were viewing the site on a mobile device or a 5K monitor. This worked really well and we saw some impressive results, but we knew we could do more with it.
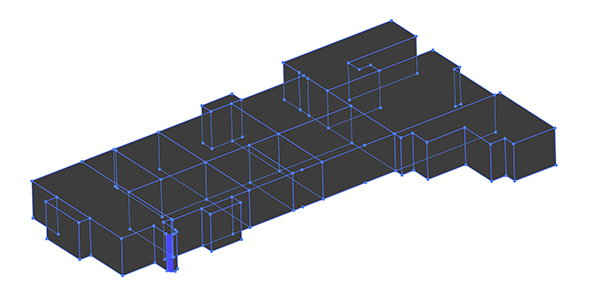
Last month, one of our clients came to us looking to have an interactive map brought onto their website. We explored a few different avenues before deciding that an SVG would solve this issue beautifully, and so we set about creating a top down image tracing of their building, and then breaking it apart in Illustrator.
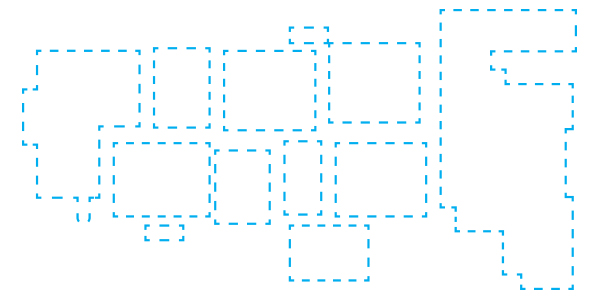
We really went to town with opacity effects and decided that it would be really cool to have an interactive hover state on each department, that when hovered would display some content below about what goes on there. The only thing left was to Bob Ross it and add in some happy little trees, and there we have it; one of the most versatile and user friendly interactive maps we think we've ever made!